Interrupting a Spot Instance
 Please note: That this workshop has been deprecated. For the latest and updated version featuring the newest features, please access the Workshop at the following link: Cost efficient Spark applications on Amazon EMR.
This workshop remains here for reference to those who have used this workshop before, or those who want to reference this workshop for earlier version.
In this section, you’re going to launch a Spot Interruption using FIS and then verify that the capacity has been replenished and EMR was able to continue running the Spark job. This will help you to confirm the low impact of your workloads when implementing Spot effectively. Moreover, you can discover hidden weaknesses, and make your workloads fault-tolerant and resilient.
Launch the Spark Application
The Spark job could take around seven to eight minutes to finish. However, when you arrive to this part of the workshop, either the job is about to finish or has finished already. So, here are the commands you need to run to re-launch the Spark job in EMR.
First, you need to empty the results folder in the S3 bucket. Run the following command (replace the bucket name with yours):
aws s3 rm --recursive s3://$S3_BUCKET/resultsspot/
Get the Cluster ID by running the following commands:
export EMRClusterName="emr-spot-workshop";
export EMRClusterID=$(aws emr list-clusters --active | jq -c '.Clusters[] | select( .Name == '\"$EMRClusterName\"' )' | jq -r '.Id');
aws emr describe-cluster --cluster-id $EMRClusterID | jq -r '.Cluster.Status';
If you got an error about not getting the a proper value for --cluster-id, you may have picked a different name for the EMR Cluster. Make sure the EMRClusterName enviroment variable matches with your EMR cluster name and run the above commands again.
Then, launch a new job using the initial Spark application but store the results at a different location:
aws emr add-steps --cluster-id $EMRClusterID --steps Type=CUSTOM_JAR,Name="Spark application",Jar="command-runner.jar",ActionOnFailure=CONTINUE,Args=[spark-submit,--deploy-mode,cluster,--executor-memory,18G,--executor-cores,4,s3://$S3_BUCKET/script.py,s3://$S3_BUCKET/resultsspot/]
Now go ahead an run the Spot interruption experiment before the jobs completes.
EMR might not have task nodes running at the moment because of managed scaling. If that’s the case, wait around two minutes (or less) until you have at least three task instances in a RUNNING state to interrupt them while the Spark job is running.
Launch the Spot Interruption Experiment
After creating the experiment template in FIS, you can start a new experiment to interrupt three (unless you changed the template) Spot instances. Run the following command:
FIS_EXP_TEMP_ID=$(aws cloudformation describe-stacks --stack-name $FIS_EXP_NAME --query "Stacks[0].Outputs[?OutputKey=='FISExperimentID'].OutputValue" --output text)
FIS_EXP_ID=$(aws fis start-experiment --experiment-template-id $FIS_EXP_TEMP_ID --no-cli-pager --query "experiment.id" --output text)
Wait around 30 seconds, and you should see that the experiment completes. Run the following command to confirm:
aws fis get-experiment --id $FIS_EXP_ID --no-cli-pager
At this point, FIS has triggered a Spot interruption notice, and in two minutes the instances will be terminated.
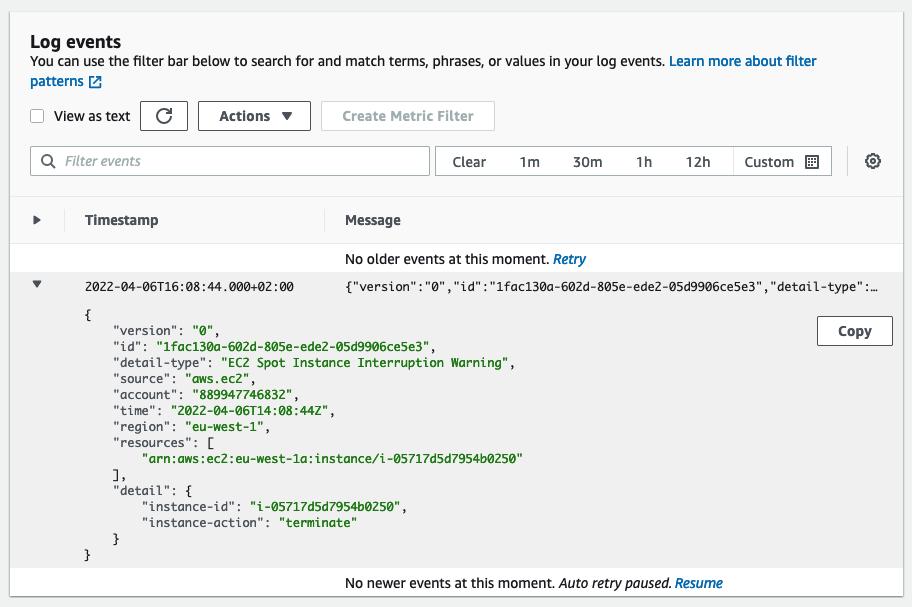
Go to CloudWatch Logs group /aws/events/spotinterruptions to see which instances are being interrupted.
You should see a log message like this one:

Verify the actions taken by EMR instance fleet
You are running EMR instance fleets with managed cluster scaling, that constantly monitors key metrics and automatically increases or decreases the number of instances or units in your cluster based on workload. EMR instance fleet can launch replacement instances, if you managed to start the FIS experiment within first minute of Spark job and Spark job runs for additional 4 to 5 minutes.
You can run the following command to see the list of instances with the date and time when they were launched.
aws ec2 describe-instances --filters\
 Name='tag:aws:elasticmapreduce:instance-group-role',Values='TASK'\
 Name='instance-state-name',Values='running'\
 | jq '.Reservations[].Instances[] | "Instance with ID:\(.InstanceId) launched at \(.LaunchTime)"'
You should see a list of instances with the date and time when they were launched. If managed scaling launched the replacements then you would see new instances with launch time different from the others.
"Instance with ID:i-06a82769173489f32 launched at 2022-04-06T14:02:49+00:00"
"Instance with ID:i-06c97b509c5e274e0 launched at 2022-04-06T14:02:49+00:00"
"Instance with ID:i-002b073c6479a5aba launched at 2022-04-06T14:02:49+00:00"
"Instance with ID:i-0e96071afef3fc145 launched at 2022-04-06T14:02:49+00:00"
"Instance with ID:i-04c6ced30794e965b launched at 2022-04-06T14:02:49+00:00"
"Instance with ID:i-0136152e14053af81 launched at 2022-04-06T14:11:25+00:00"
"Instance with ID:i-0ff78141712e93850 launched at 2022-04-06T14:11:25+00:00"
"Instance with ID:i-08818dc9ba688c3da launched at 2022-04-06T14:11:25+00:00"
Verify that the Spark application completed successfully
Follow the same steps from “Examining the cluster” to launch the Spark History Server and explore the details of the recent Spark job submission. Here’s the command you need to run:
ssh -i ~/environment/emr-workshop-key-pair.pem -N -L 8080:$EMRClusterDNS:18080 hadoop@$EMRClusterDNS
Now click on the Preview Running Application under the Preview menu at the top. You’ll see a browser window opening with in the Cloud9 environment with a refused connection error page. Click on the button next to Browser (arrow inside a box) to open web UI in a dedicated browser page.
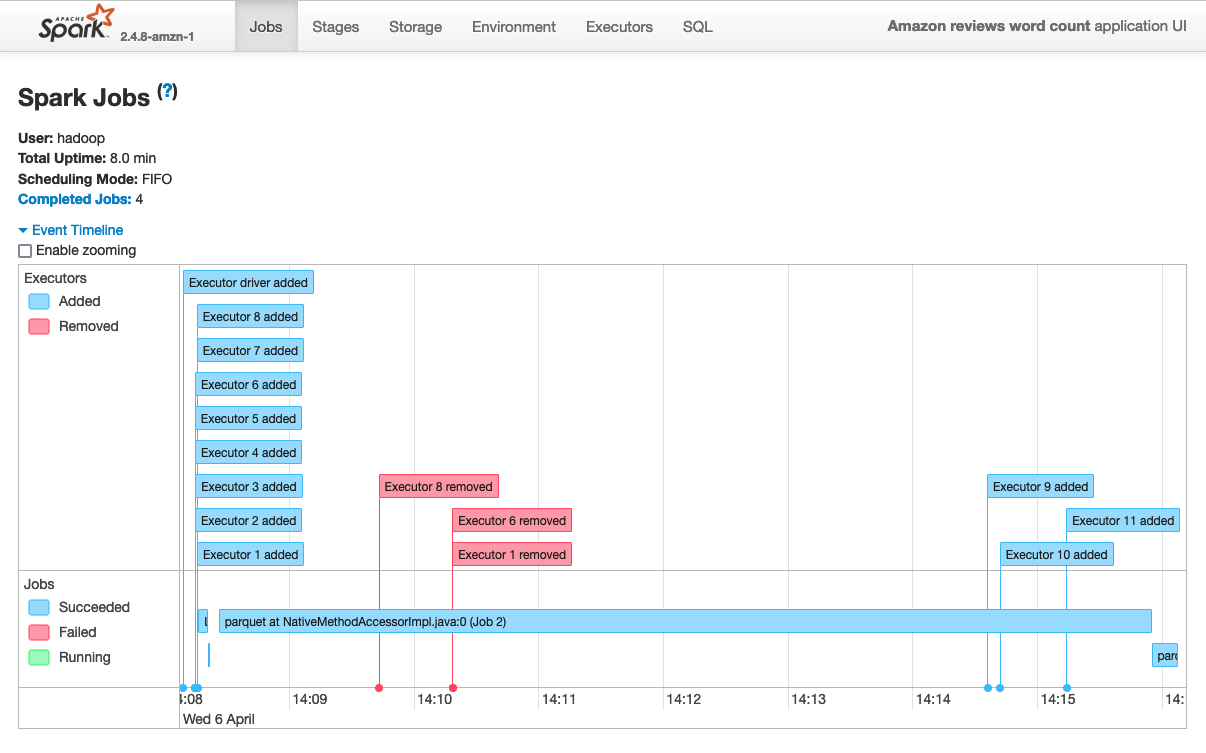
In the home screen, click on the latest App ID (if it’s empty, wait for the job to finish) to see the execution details. You should see something like this:

Notice how two minutes around after the job started, three executors were removed (each executor is a Spot instance). If your job runs long enough then you can see new executors being launched to catch-up on completing the job. In this example the job took around eight minutes to finish. If you don’t see executors being added, you could re-launch the Spark job and start the FIS experiment as soon as the spark job starts.
Actions for decommissioned nodes
When a Spot Instance is interrupted, no new tasks get scheduled, and the active containers become idle (or the timeout expires), the node gets decommissioned. When the Spark driver receives the decommissioned signal, it can take the following additional actions to start the recovery process sooner rather than waiting for a fetch failure to occur:
-
All of the shuffle outputs on the decommissioned node are unregistered, thus marking them as unavailable. Amazon EMR enables this by default with the setting spark.resourceManager.cleanupExpiredHost set to true. This has the following advantages:
-
If a single node is decommissioned during map stage: lost shuffle is recomputed elsewhere before proceeding to the next Stage. Faster recovery as shuffle blocks computed during the map stage instead failures during shuffle stage.
-
If a single node is decommissioned during shuffle stage: target executors immediately sends the fetch failure to the driver instead of multiple retrying fetch the lost shuffle block. The driver then immediately fails the stage and starts recomputing the lost shuffle output. Reduces the time spent trying to fetch shuffle blocks from lost nodes.
-
If multiple nodes are decommissioned during any stage: Spark schedules the first re-attempt to compute the missing blocks, it notices all of the missing blocks from decommissioned nodes and recovers in a single attempt. This speeds up the recovery process significantly over the open-source Spark implementation.
-
When a stage fails because of fetch failures from a node being decommissioned, by default, Amazon EMR does not count the stage failure toward the maximum number of failures allowed for a stage by the setting spark.stage.attempt.ignoreOnDecommissionFetchFailure set to true. This prevents a job from failing if a stage fails multiple times because of node failures due to Spot Instance termination.
Below is a script that groups all the above commands to run them all at once. After running this script, you should be able to see the Spark job timeline in the Spark History Server page. You can tweak the sleep time to interrupt instances in the middle of the Spark job execution.
cat <<'EOF' > spotexperiment.sh
#!/bin/bash
aws s3 rm --recursive s3://$S3_BUCKET/resultsspot/;
export EMRClusterName="emr-spot-workshop";
export EMRClusterID=$(aws emr list-clusters --active | jq -c '.Clusters[] | select( .Name == '\"$EMRClusterName\"' )' | jq -r '.Id');
aws emr describe-cluster --cluster-id $EMRClusterID | jq -r '.Cluster.Status';
aws emr add-steps --cluster-id $EMRClusterID --steps Type=CUSTOM_JAR,Name="Spark application",Jar="command-runner.jar",ActionOnFailure=CONTINUE,Args=[spark-submit,--deploy-mode,cluster,--executor-memory,18G,--executor-cores,4,s3://$S3_BUCKET/script.py,s3://$S3_BUCKET/resultsspot/];
export FIS_EXP_TEMP_ID=$(aws cloudformation describe-stacks --stack-name $FIS_EXP_NAME --query "Stacks[0].Outputs[?OutputKey=='FISExperimentID'].OutputValue" --output text);
echo "Waiting 90 seconds to have Task nodes running ...";
sleep 90;
echo "Sending the Spot interruption ...";
export FIS_EXP_ID=$(aws fis start-experiment --experiment-template-id $FIS_EXP_TEMP_ID --no-cli-pager --query "experiment.id" --output text);
export EMRClusterDNS=$(aws emr describe-cluster --cluster-id $EMRClusterID | jq -r '.Cluster.MasterPublicDnsName');
echo "Done! You can now open the Preview Application Server to review the Spark History Server ..."
ssh -i ~/environment/emr-workshop-key-pair.pem -N -L 8080:$EMRClusterDNS:18080 hadoop@$EMRClusterDNS;
EOF
Then run the script like this:
sh spotexperiment.sh
Now open the Spark History Sever using the Preview Running Application feature from Cloud9 to review the job timeline.