Monitoring and results
Results
You can check progress by running these commands in the Cloud9 terminal:
while [ true ]
do
  while [ true ]
  do
    export MC_JOB_ID=$(aws batch list-jobs --job-queue "${MC_QUEUE_NAME}" --filters name=JOB_NAME,values="${JOB_NAME}" --query 'jobSummaryList[*].jobId' | jq -r '.[0]')

    if [ ! -z "$MC_JOB_ID" ] ; then
      break
    fi

    echo "Calculation not started yet"
    sleep 5
  done

  export MC_PROGRESS=$(aws batch describe-jobs --jobs "${MC_JOB_ID}")
  export PV_COUNT=$(echo $MC_PROGRESS | jq -r '.jobs[0].arrayProperties.statusSummary.SUCCEEDED')
  export PV_TO_CALC=$(echo $MC_PROGRESS | jq -r '.jobs[0].arrayProperties.size')

  awk -v var1=$PV_TO_CALC -v var2=$PV_COUNT 'BEGIN { print  ("PV progress: " (var2 / var1) * 100 "% ==> " var2 " out of " var1 " PVs complete") }'

  if [ "${PV_COUNT}" == "${PV_TO_CALC}" ] ; then
    break
  fi

  sleep 5
done
It is normal if the progress is stuck at 0% at the beginning and after it increases rapidly. The reason for this is that AWS Batch is provisioning capacity for the Compute environments as defined earlier, and jobs will remain in the RUNNABLE state until sufficient resources are available. You can read more about job states here: Job States.
This operation will take about 10 minutes. While it progresses, go to the AWS Batch Console, and explore the state of: (a) Compute Environments, (b) Jobs. You can also check in the EC2 Console the: (c) EC2 Instances and (d) Auto Scaling groups defined.
When the progress reaches 100%, the aggregate PV file will be available in the following URL:
echo "Output url: https://s3.console.aws.amazon.com/s3/buckets/${BucketName}?region=${AWS_DEFAULT_REGION}&prefix=aggregation_${JOB_NAME}.json"
Copy the output of the command into your browser. It will take you to the S3 page where the output PV aggregation file has been stored. You can just click on the Download button to download it to your own computer and view it.
Monitoring
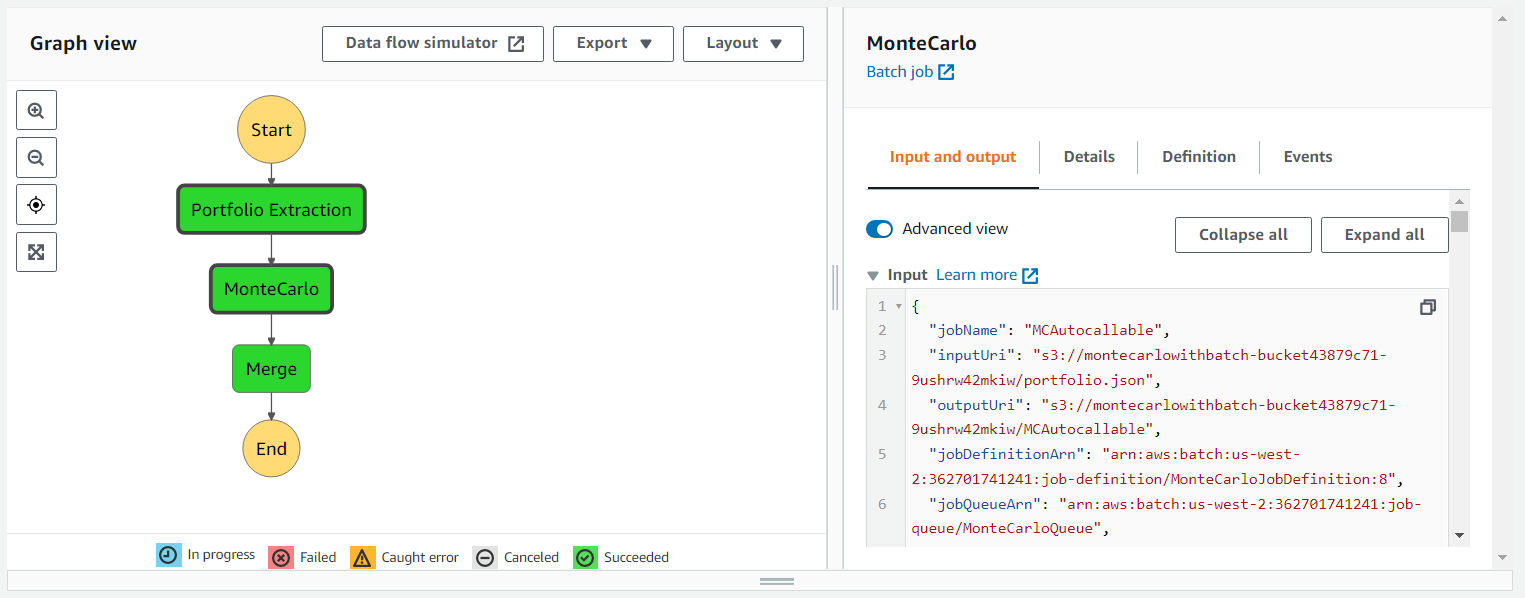
Viewing the execution of the state machine
You can follow the progress of the pipeline by navigating to the executions tab of the state machine. To do it:
- Navigate to the AWS Step Functions service page.
- Select the state machine whose name begins with MonteCarloPipeline.
- In the executions tab, select the first entry.
- In the graph inspector, you can select a state to see the input it receives and the output it produces.
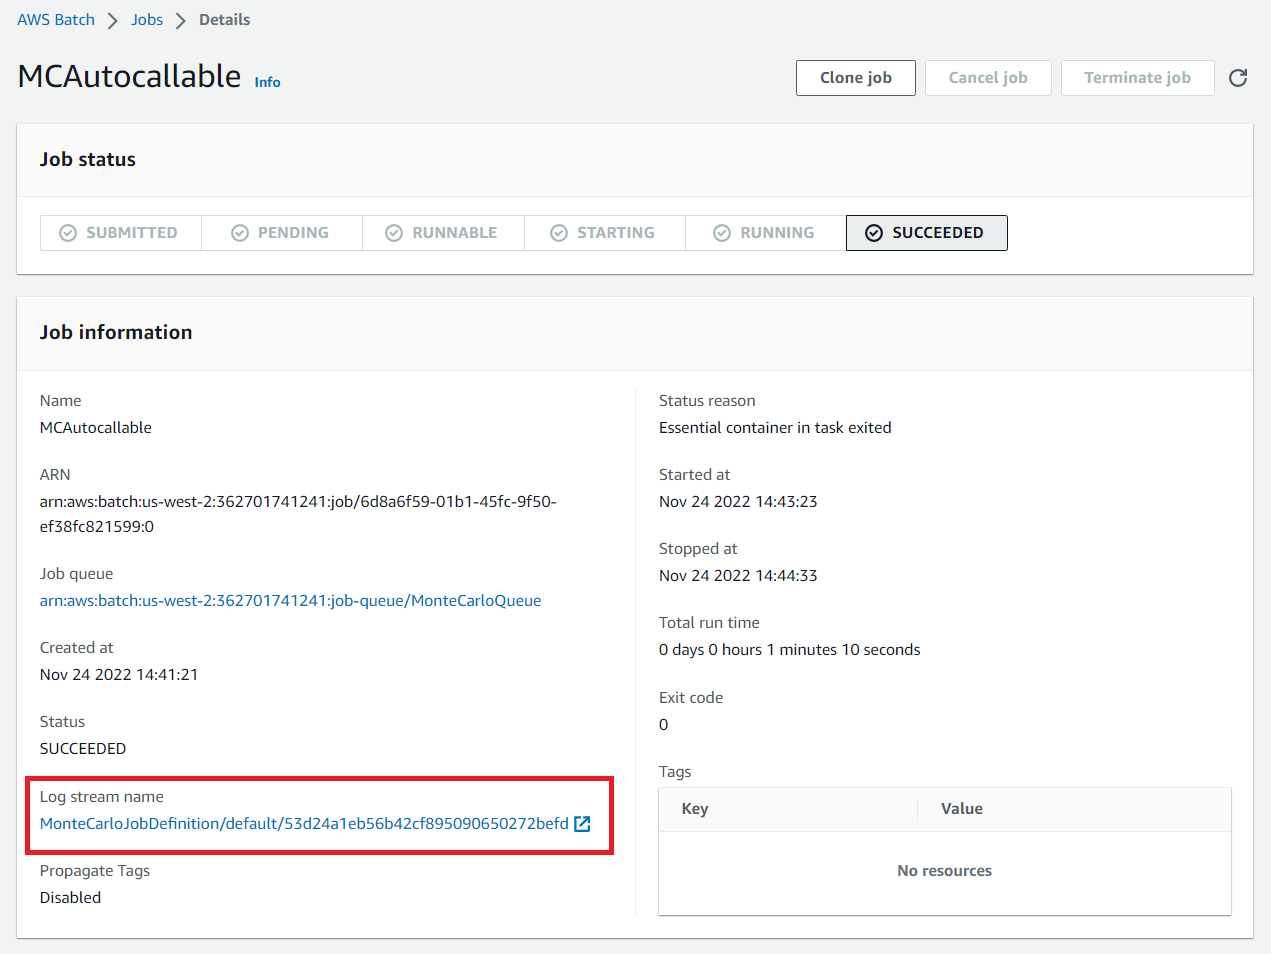
Viewing the logs of a job
To view the logs of a job using the console:
- Navigate to the AWS Batch service page.
- On the left navigation panel, select Jobs.
- Select the job of which you want to view the logs.
- Follow the link under Log stream name inside the Job information section.
Monitoring the status of a job
You can monitor the status of a job using the following command:
aws batch describe-jobs --jobs "${MC_JOB_ID}"
To learn more about this command, you can review the describe-jobs CLI command reference.
Describing a queue
You can review the configuration of a queue using the following command:
aws batch describe-job-queues --job-queues "${MC_QUEUE_NAME}"
To learn more about this command, you can review the describe-job-queues CLI command reference.
Describing a compute environment
You can review the configuration of a compute environment using the following command:
aws batch describe-compute-environments --compute-environments "${SPOT_COMPUTE_ENV_NAME}" "${ONDEMAND_COMPUTE_ENV_NAME}"
To learn more about this command, you can review the describe-compute-environments CLI command reference.
Describing a job definition
You can review the configuration of a job definition using the following command:
aws batch describe-job-definitions --job-definition-name "${JOB_DEFINITION_NAME}"
To learn more about this command, you can review the describe-job-definitions CLI command reference.