Savings Summary
 Please note: This workshop version is now deprecated, and an updated version has been moved to AWS Workshop Studio. This workshop remains here for reference to those who have used this workshop before for reference only. Link to updated workshop is here: Launching EC2 Spot Instances.
Spot Savings
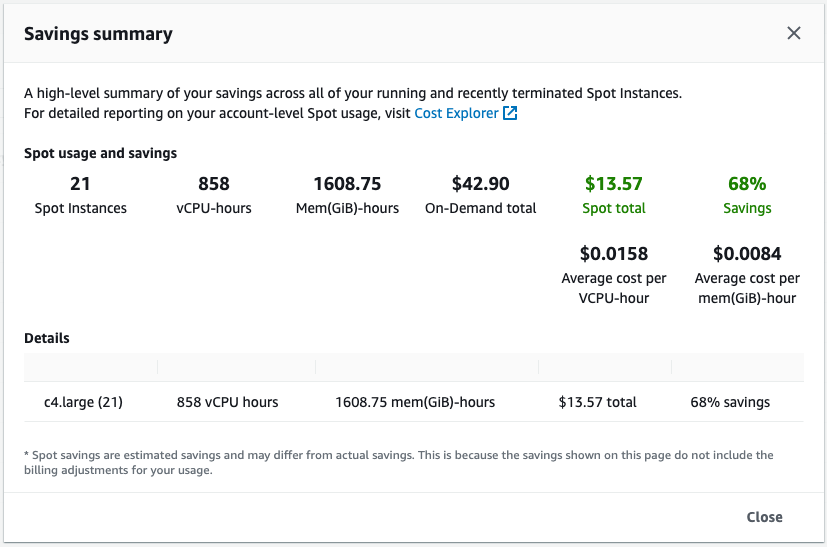
So far we have launched Spot instances in a few ways. Here is a question: How much do you think we saved on these workloads?
You can check how much you have saved with Spot instances by going to the Savings Summary panel. To view your savings do the following:
- Open the Amazon EC2 console at https://console.aws.amazon.com/ec2/.
- In the navigation pane, choose Spot Requests.
- In the top right corner of the screen, select Savings summary

Spot price history & Spot notifications
There are more APIs that you can use to learn more about Spot.
Some projects, like the EC2 Spot Interruption Dashboard can be used as the initial point to understand which Spot Instances are being terminated and adjust your configuration by increasing diversification.
Some other APIs might be useful to understand how the Spot price changes over time, which you can also see in the AWS Console by:
- Open the Amazon EC2 console at https://console.aws.amazon.com/ec2/.
- In the navigation pane, choose Spot Requests.
- Choose Pricing history in the top right corner.
If you are interested in how to use the Spot API programmatically, You can use the describe-spot-price-history API to retrieve the information you need.
Cost Management Tools
You can also view the Spot Savings using AWS Cost Explorer, which has an easy-to-use interface that lets you visualize, understand, and manage your AWS costs and usage over time, including Spot Instances. You can use Cost Explorer filtered by “Purchase Options” to see patterns in how much you spend on Spot Instances over time, and see trends that you can use to understand your costs. You can view data up to the last 12 months, and forecast the next three months.

AWS Customers have access to raw cost and usage data through the AWS Cost and Usage (AWS CUR) reports. These reports contain the most comprehensive information about your AWS usage and costs. If you’re using Spot Instances for your compute needs, then AWS CUR populates the Amazon EC2 Spot usage pricing columns and the product columns. With this data, you can calculate the past savings achieved with Spot through the AWS CUR.