Explore Kube-ops-view
 Please note: this EKS and Karpenter workshop version is now deprecated since the launch of Karpenter v1beta, and has been updated to a new home on AWS Workshop Studio here: Karpenter: Amazon EKS Best Practice and Cloud Cost Optimization.
This workshop remains here for reference to those who have used this workshop before, or those who want to reference this workshop for running Karpenter on version v1alpha5.
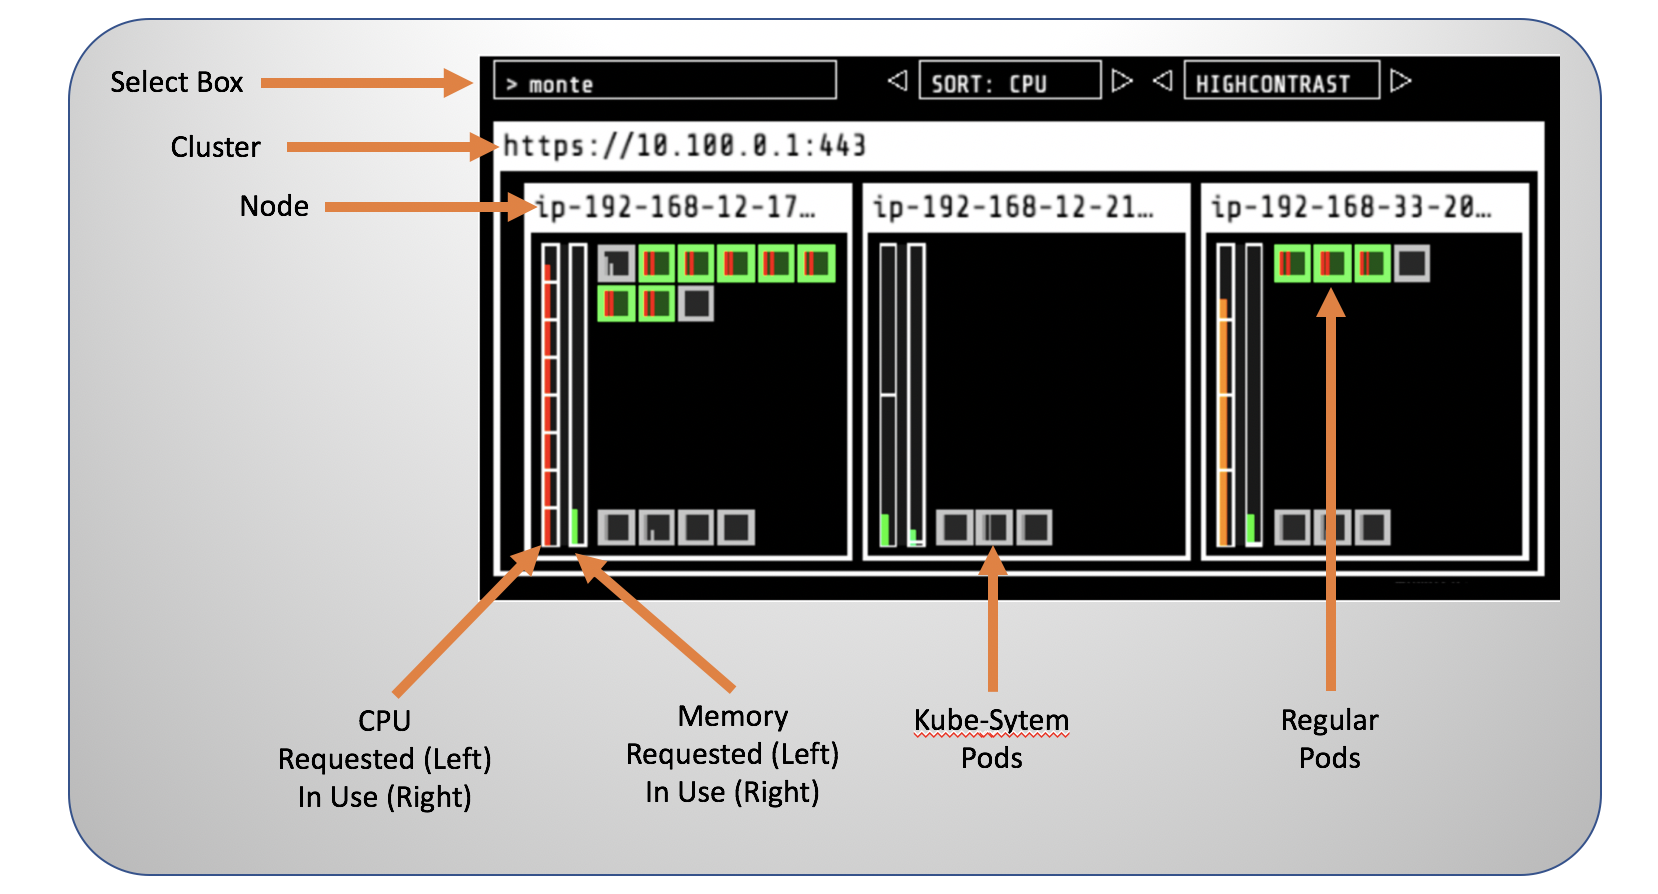
We installed Kube-ops-view from Henning Jacobs. Kube-ops-view will help with understanding our cluster setup in a visual way, similar to eks-node-viewer.
Monitoring and visualization shouldn’t be typically be exposed publicly unless the service is properly secured and provide methods for authentication and authorization. You can still deploy kube-ops-view as Service of type ClusterIP by removing the --set service.type=LoadBalancer section and using kubectl proxy. Kube-ops-view does also support Oauth 2
To check kube-ops-view was installed successfully:
kubectl get svc
should display :
NAME            TYPE           CLUSTER-IP       EXTERNAL-IP                                                               PORT(S)        AGE
kube-ops-view   LoadBalancer   10.100.162.132   addb6e7f91aae4b0dbd6f5833f9750c3-1014347204.eu-west-1.elb.amazonaws.com   80:31628/TCP   3m58s
With this we can explore kube-ops-view output by checking the details about the newly service created.
kubectl get svc kube-ops-view | tail -n 1 | awk '{ print "Kube-ops-view URL = http://"$4 }'
This will display a line similar to Kube-ops-view URL = http://<URL_PREFIX_ELB>.amazonaws.com
Opening the URL in your browser will provide the current state of our cluster.
You may need to refresh the page and clean your browser cache. The creation and setup of the LoadBalancer may take a few minutes; usually in two minutes you should see kub-ops-view.
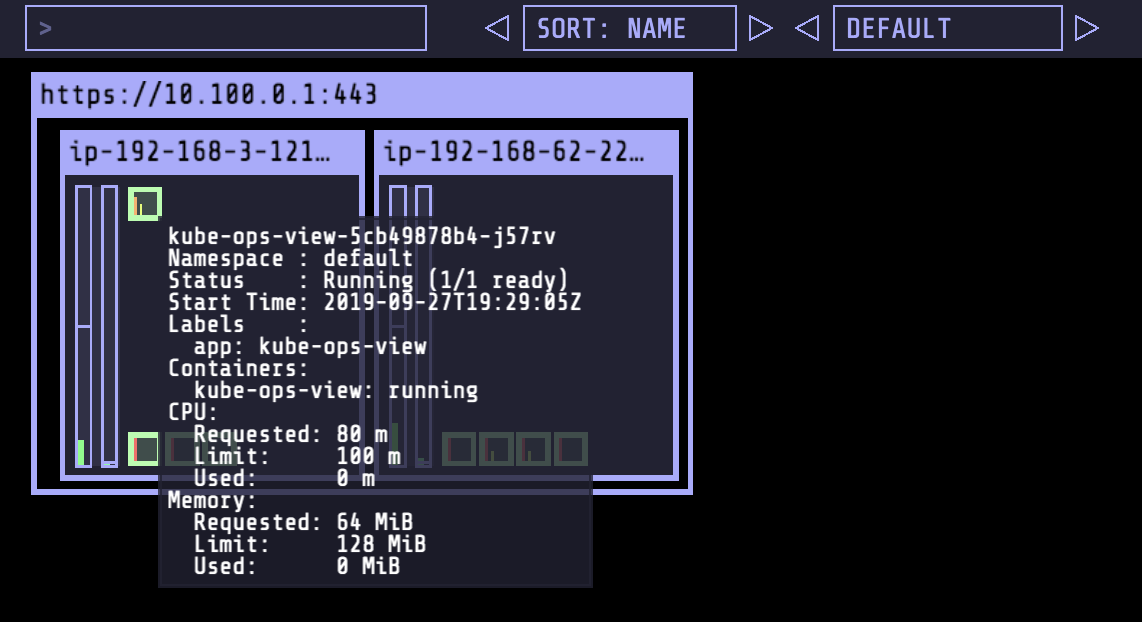
As this workshop moves along and you create Spot workers, and perform scale up and down actions, you can check the effects and changes in the cluster using kube-ops-view. Check out the different components and see how they map to the concepts that we have already covered during this workshop.
Spend some time checking the state and properties of your EKS cluster.
(Optional) EKS-NODE-VIEWER
Alternatively or at the same time that you use Kube-ops-view, you can also use a eks-node-viewer. eks-node-viewer is a tool for visualizing dynamic node usage within a cluster. It was originally developed as an internal tool at AWS for demonstrating consolidation with Karpenter. It displays the scheduled pod resource requests vs the allocatable capacity on the node. It does not look at the actual pod resource usage.
To launch it execute the following in a new Cloud9 terminal:
eks-node-viewer
It will display a console similar to the one below. You can keep it running and keep coming to this Tab to check how the console changes over time with new nodes apearing as we go through the workshop.
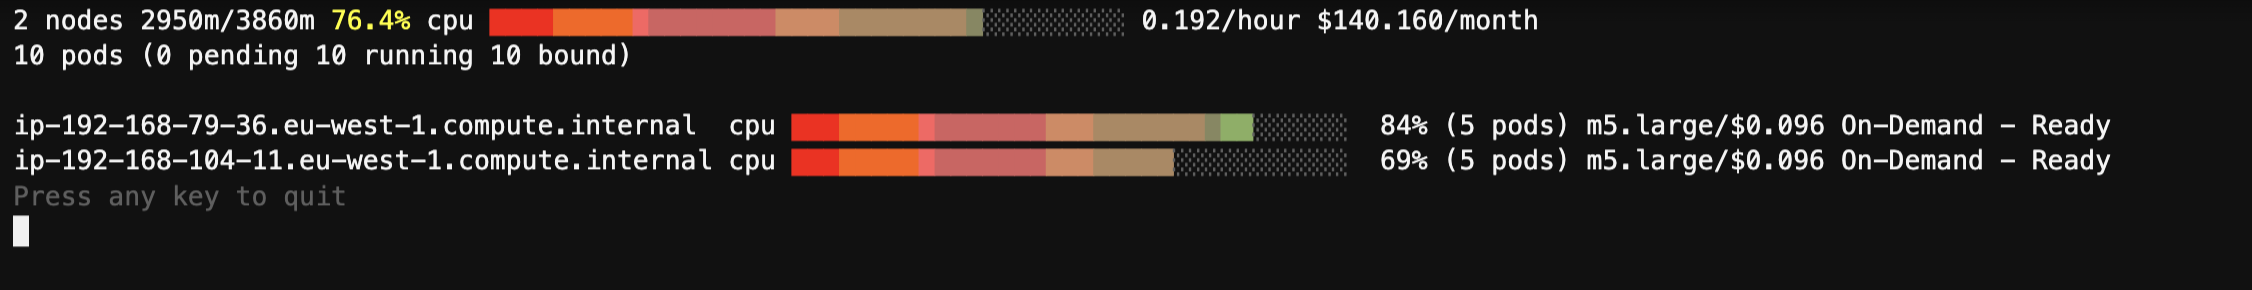
You might not see all the colours as you see in the screenshot but that’s fine. This can be fixed if you open a new terminal in Cloud9 and run the command.