Examining the cluster
 Please note: That this workshop has been deprecated. For the latest and updated version featuring the newest features, please access the Workshop at the following link: Cost efficient Spark applications on Amazon EMR.
This workshop remains here for reference to those who have used this workshop before, or those who want to reference this workshop for earlier version.
Please note: That this workshop has been deprecated. For the latest and updated version featuring the newest features, please access the Workshop at the following link: Cost efficient Spark applications on Amazon EMR.
This workshop remains here for reference to those who have used this workshop before, or those who want to reference this workshop for earlier version.
In this section you will look at the utilization of instance fleets and examine Spark executors, while the Spark application is running.
EMR Cluster Status
To get started, let’s check that your EMR cluster and Spark application are running.
export EMRClusterName="emr-spot-workshop";
export EMRClusterID=$(aws emr list-clusters --active | jq -c '.Clusters[] | select( .Name == '\"$EMRClusterName\"' )' | jq -r '.Id');
aws emr describe-cluster --cluster-id $EMRClusterID | jq -r '.Cluster.Status';
If you got an error about not getting the a proper value for --cluster-id, you may have picked a different name for the EMR Cluster. Make sure the EMRClusterName enviroment variable matches with your EMR cluster name and run the above commands again.
Wait until you get the cluster status on RUNNING with eather a message of Running step, like the following output:
{
  "State": "RUNNING",
  "StateChangeReason": {
    "Message": "Running step"
  },
  "Timeline": {
    "CreationDateTime": "2022-11-14T15:07:08.730000+00:00",
    "ReadyDateTime": "2022-11-14T15:12:18.753000+00:00"
  }
}
EMR On-cluster application user interfaces
To connect to the application user interfaces running on our EMR cluster you need to use SSH tunneling. Click here to learn more about connecting to EMR interfaces.
First, we need to grant SSH access from the Cloud9 environment to the EMR cluster master node. To do so, run the following commands:
export EMRMasterSG=$(aws emr describe-cluster --cluster-id $EMRClusterID | jq -r '.Cluster.Ec2InstanceAttributes.EmrManagedMasterSecurityGroup');
aws ec2 authorize-security-group-ingress \
    --group-id $EMRMasterSG \
    --protocol tcp \
    --port 22 \
    --cidr 172.31.0.0/16;
At this stage, you will be able to ssh into the EMR master node.
In the following steps, you might not see full utilization of vCPUs and Memory on the EC2 instances because the wordcount demo Spark application is not very resource intensive.
Access Resource Manager web interface
-
Get the EMR Cluster DNS endpoint by running the following command on your Cloud9 environment:\
export EMRClusterDNS=$(aws emr describe-cluster --cluster-id $EMRClusterID | jq -r '.Cluster.MasterPublicDnsName'); -
Establish an SSH tunnel to port 8088, where Resource Manager is bound, by executing the below command:
ssh -i ~/environment/emr-workshop-key-pair.pem -N -L 8080:$EMRClusterDNS:8088 hadoop@$EMRClusterDNS;You’ll get a message saying the authenticity of the host can’t be established. Type ‘yes’ and hit enter. The message will look similar to the following:
The authenticity of host 'ec2-54-195-131-148.eu-west-1.compute.amazonaws.com (172.31.36.62)' can't be established. ECDSA key fingerprint is SHA256:Cmv0qkh+e4nm5qir6a9fPN5DlgTUEaCGBN42txhShoI. ECDSA key fingerprint is MD5:ee:63:d0:4a:a2:29:8a:c9:41:1b:a1:f0:f6:8e:68:4a. Are you sure you want to continue connecting (yes/no)? -
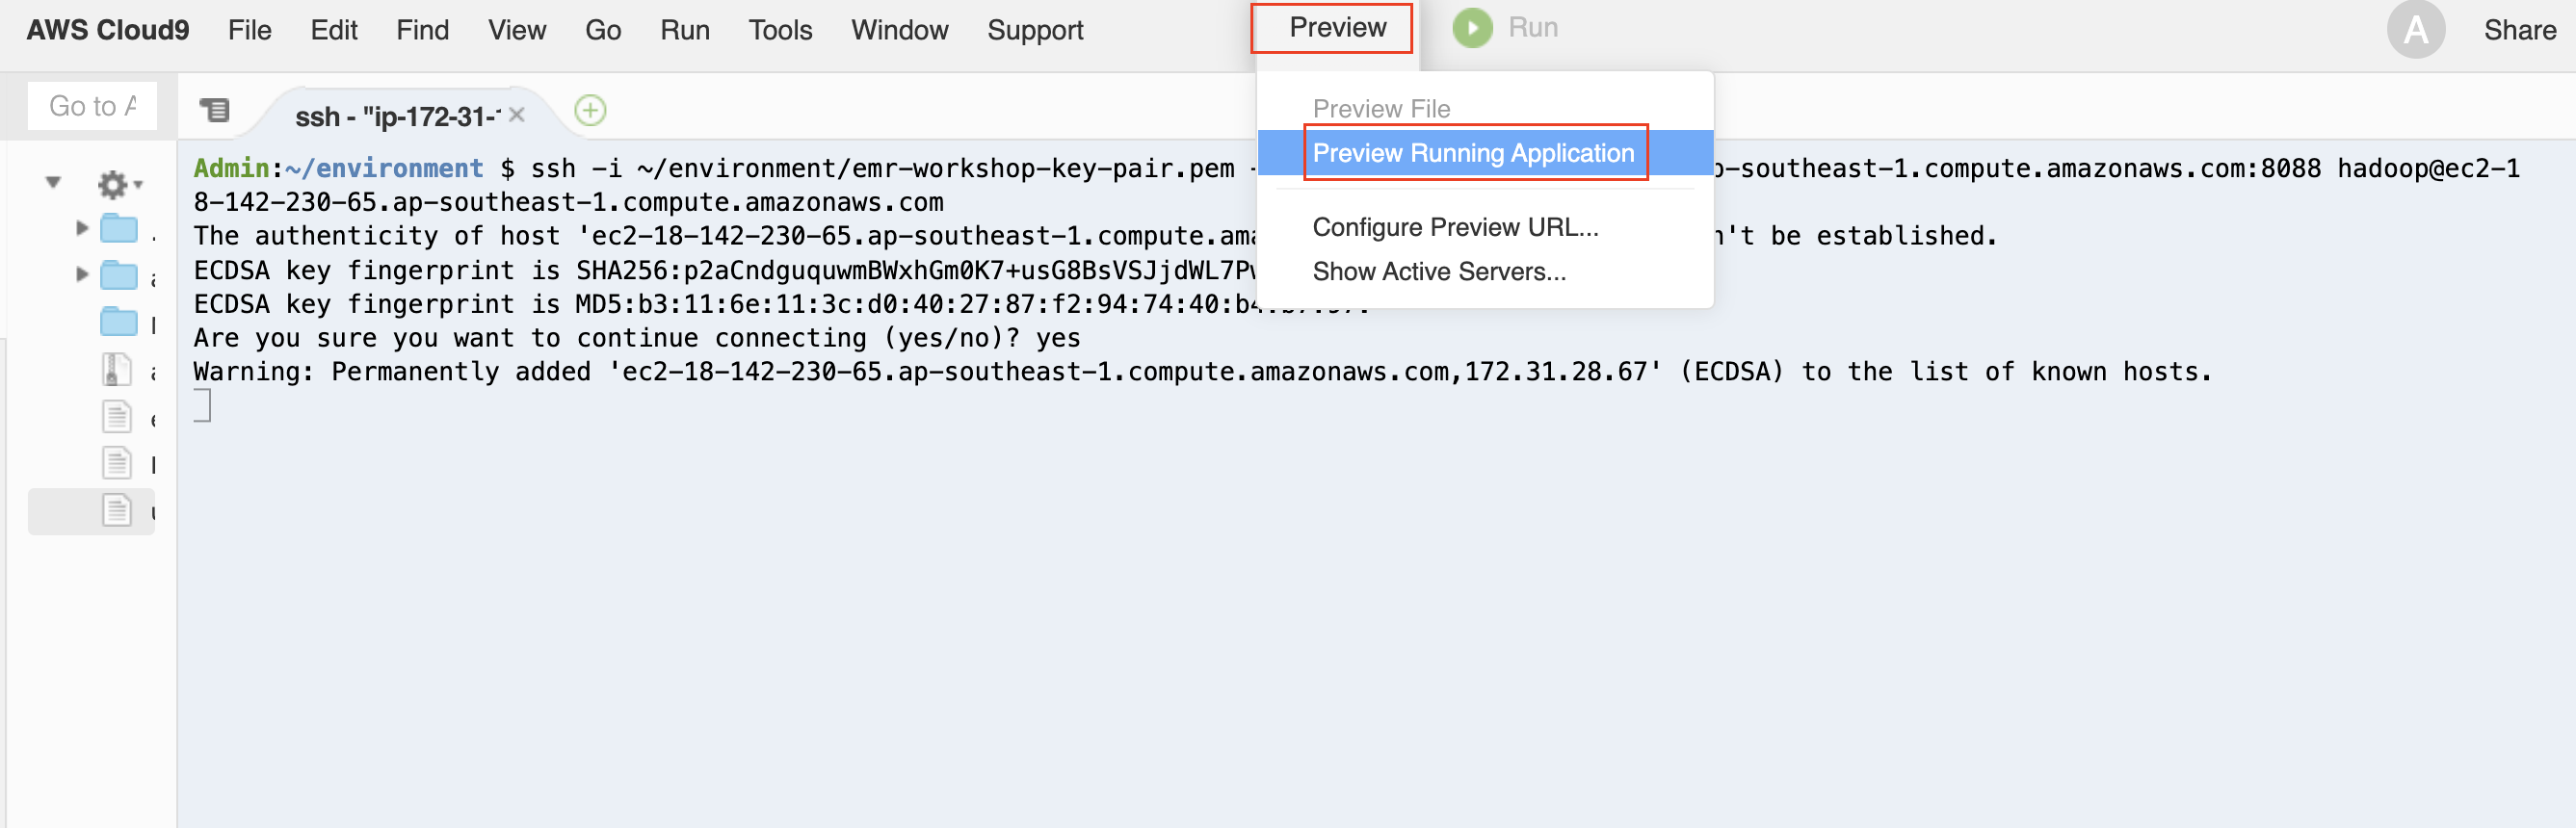
Now, on your Cloud9 environment, click on the Preview menu on the top and then click on Preview Running Application.
-
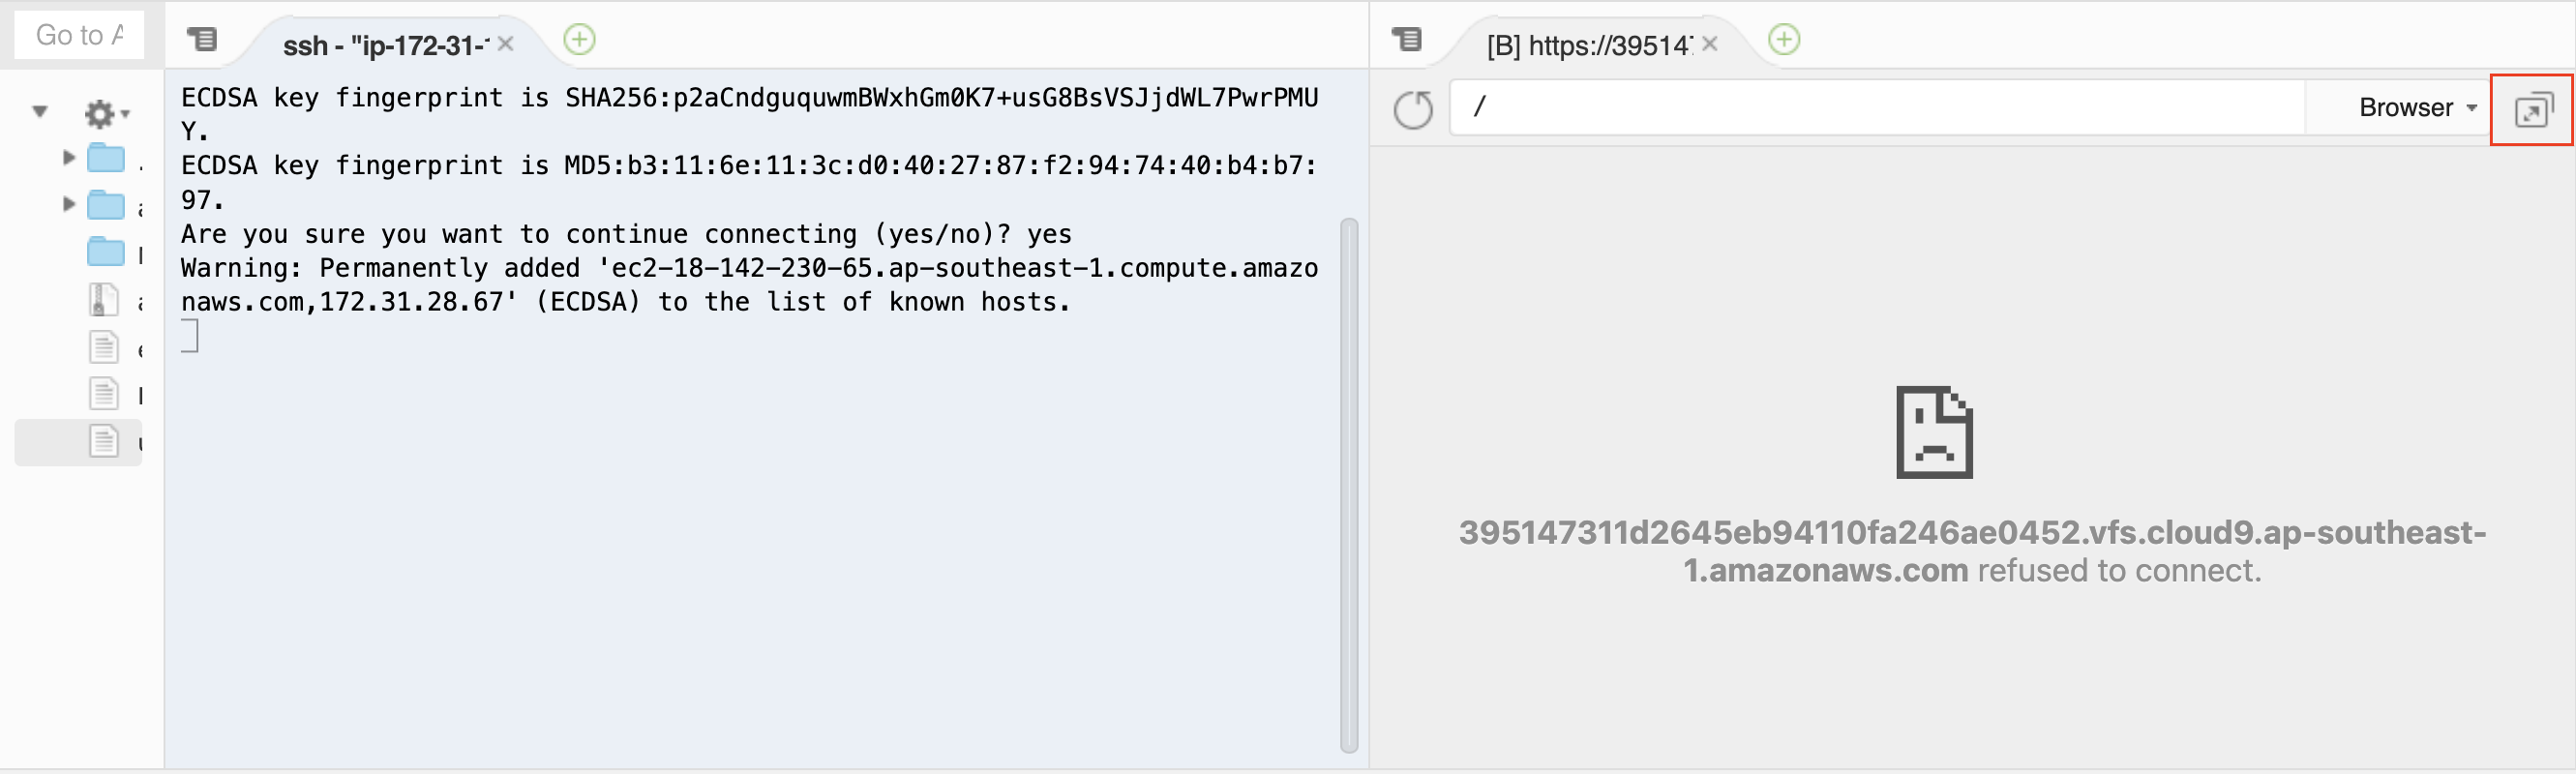
You’ll see a browser window opening with in the Cloud9 environment with a refused connection error page. Click on the button next to Browser (arrow inside a box) to open web UI in a dedicated browser page.
-
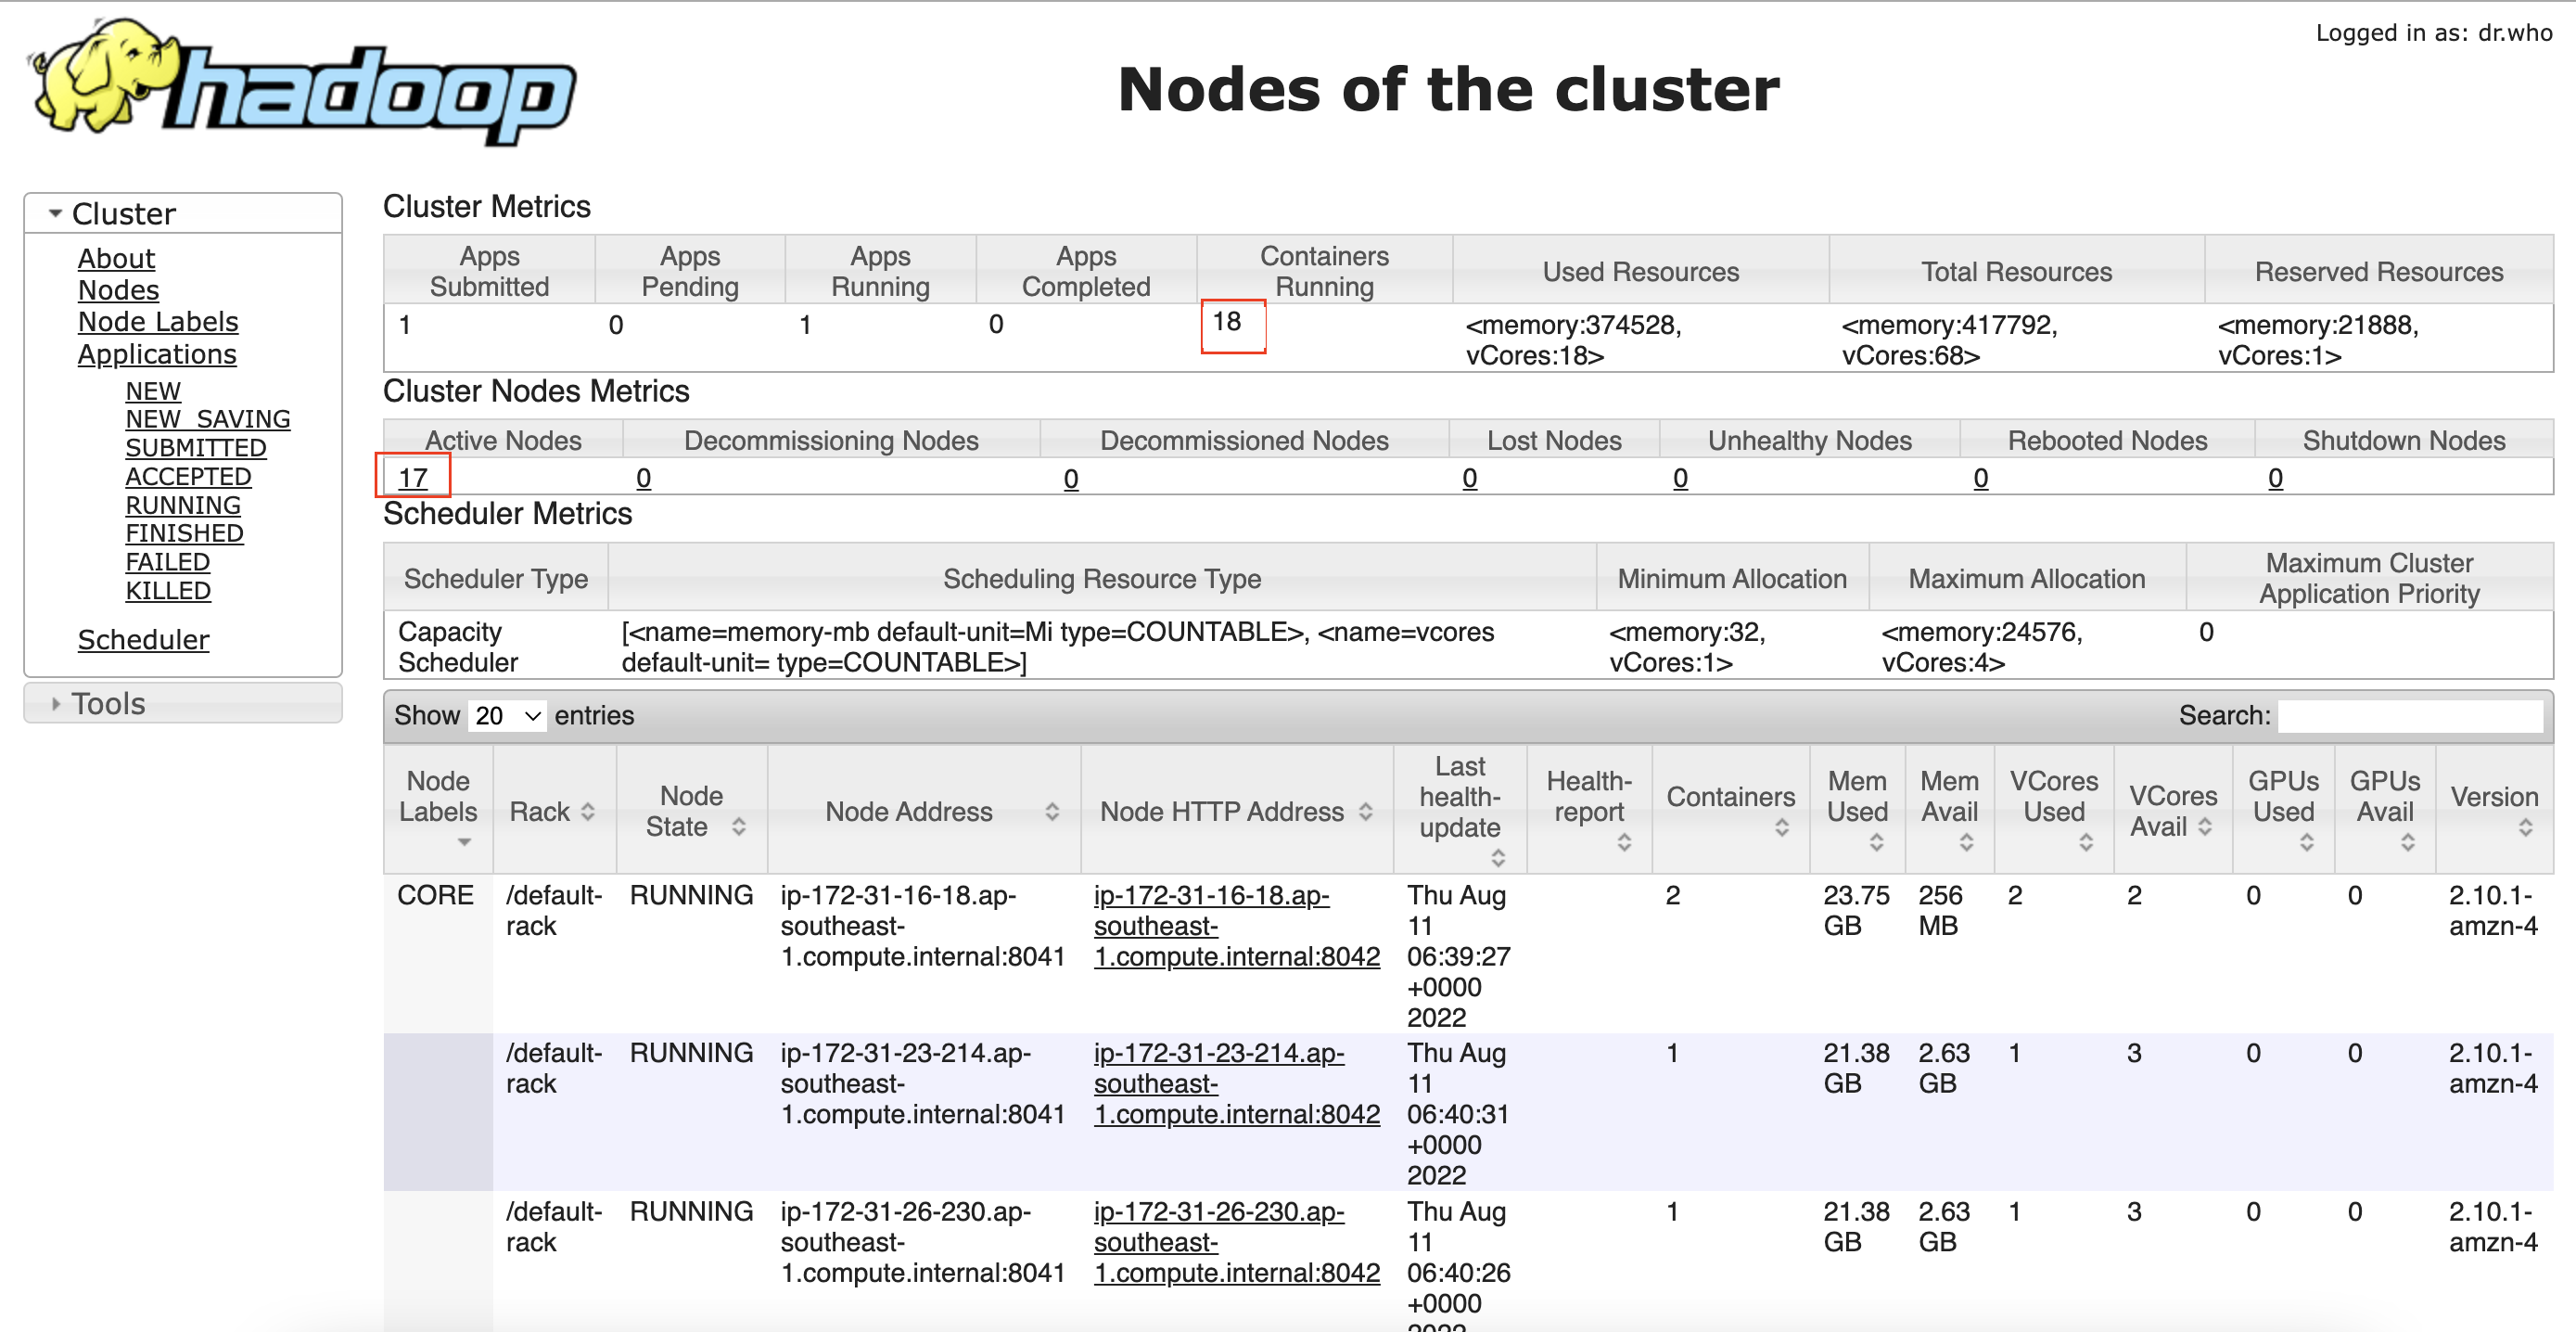
On the left pane, click on Nodes:
-
If the Spark App is Running, then in the Cluster Metrics table the Containers Running will be 18. In Cluster Nodes Metrics table, the number of Active Nodes will be 17 (1 core node with CORE Label and 16 task nodes without any Node Label).
-
If the Spark App is Completed, then Containers Running will be 0, Active Nodes will be 1 (1 core node with CORE Label) and 16 Decommissioned Nodes (16 task nodes will be decommissioned by EMR managed cluster scaling).
-
If you can’t access the Resource Manager page, try using a different browser or check the network security policies in your computer. Your browser might have third-party cookies disabled, to enable them check this link: https://docs.aws.amazon.com/cloud9/latest/user-guide/troubleshooting.html#troubleshooting-preview.
Challenge
Now that you are familiar with EMR web interfaces, can you try to access Ganglia and Spark History Server application user interfaces?
Go to Application user interfaces tab to see the user interfaces URLs for Ganglia and Spark History Server.
Access Ganglia user interface
-
Go to the Cloud9 terminal where you have established the ssh tunnel, and press ctrl+c to close the tunnel used by the previous web UI.
-
Establish an SSH tunnel to port 80, where Ganglia is bound, by executing the below command on your Cloud9 environment:
ssh -i ~/environment/emr-workshop-key-pair.pem -N -L 8080:$EMRClusterDNS:80 hadoop@$EMRClusterDNS -
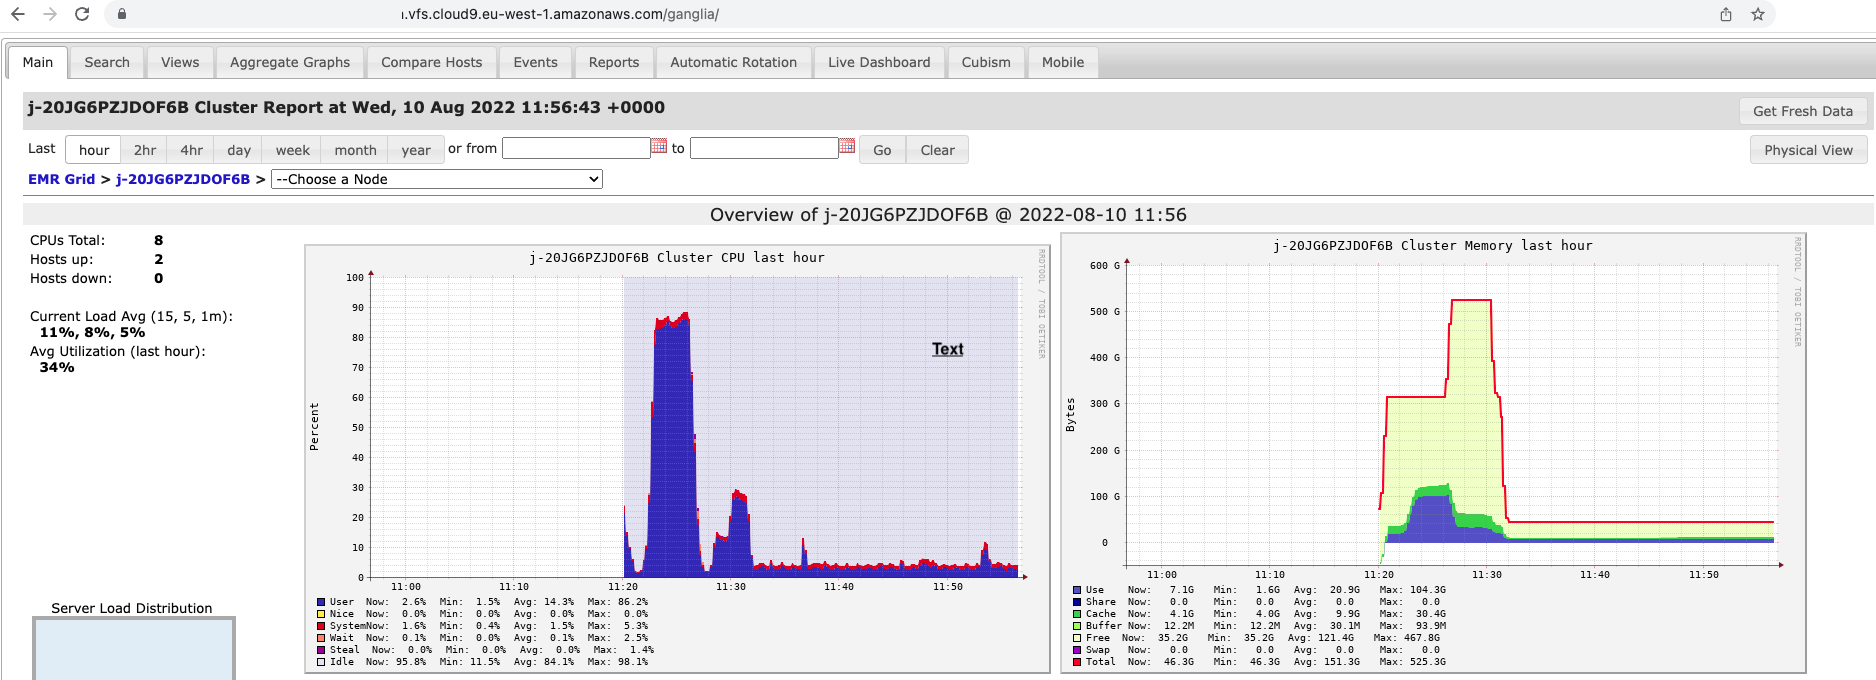
Now, go back to the browser where Resource Manager was running, and append /ganglia/ to the URL access the Ganglia Interface The URL should look like:
https://xxxxxx.vfs.cloud9.eu-west-1.amazonaws.com/ganglia/ -
Take notice of the heatmap (Server Load Distribution). Notable graphs are:
- Cluster CPU last hour - this will show you the CPU utilization that our Spark application consumed on our EMR cluster. you should see that utilization varied and reached around 70%.
- Cluster Memory last hour - this will show you how much memory we started the cluster with, and how much Spark actually consumed.
Access Spark History Server application user interface
-
Go to the Cloud9 terminal where you have established the ssh tunnel, and press ctrl+c to close the tunnel used by the previous web UI.
-
Establish an SSH tunnel to port 18080, where Spark History Server is bound, by executing the below command on your Cloud9:
ssh -i ~/environment/emr-workshop-key-pair.pem -N -L 8080:$EMRClusterDNS:18080 hadoop@$EMRClusterDNS -
Now, on your browser, go to the base URL of your Cloud9 preview application i.e.
https://xxxxxx.vfs.cloud9.eu-west-1.amazonaws.com/ -
Click on the App ID in the table (where App Name = Amazon reviews word count) and go to the Executors tab
-
You can again see the number of executors that are running in your EMR cluster under the Executors table
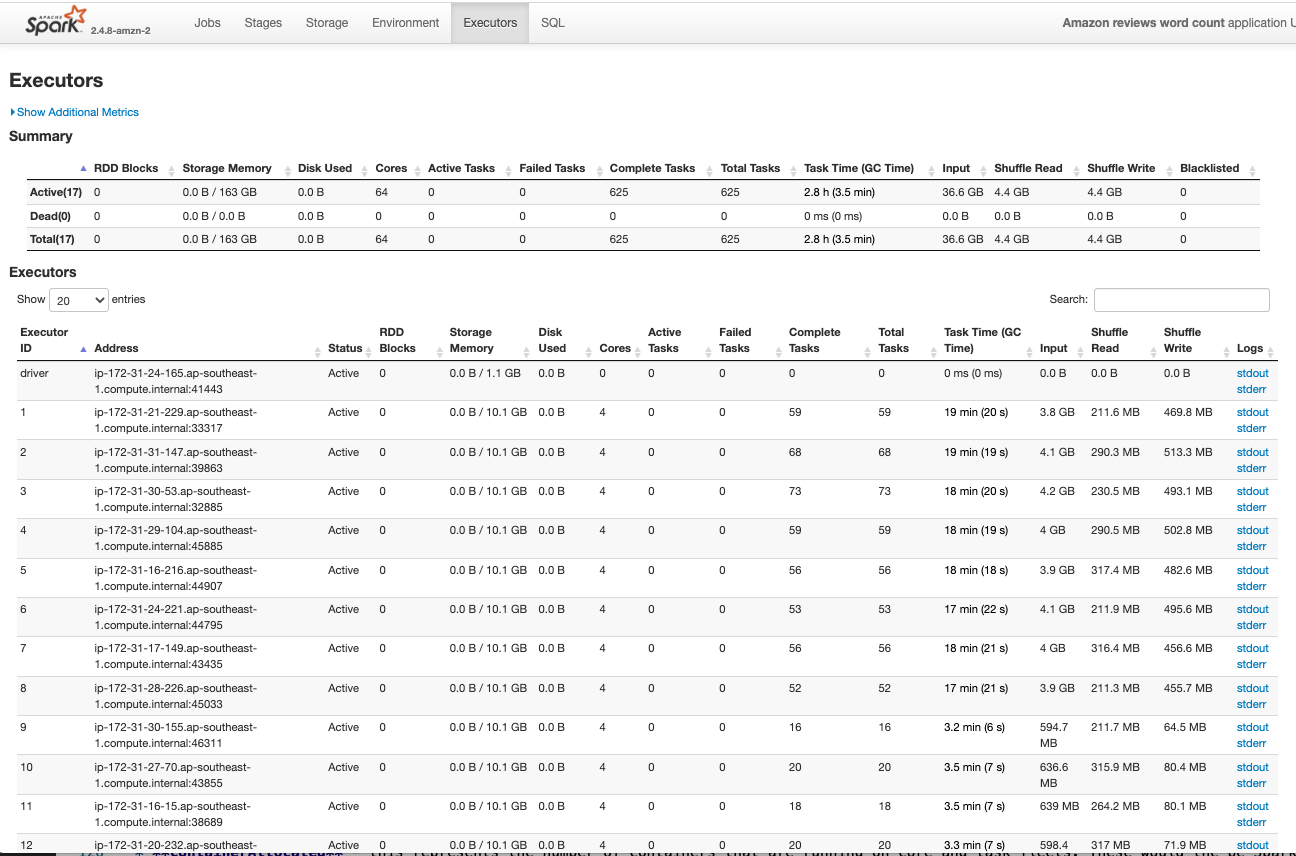
Managed Scaling in Action
You enabled managed cluster scaling and EMR scaled out to 64 Spot units in the task fleet. EMR could have launched either 16 * xlarge (running one executor per xlarge) or 8 * 2xlarge instances (running 2 executors per 2xlarge) or 4 * 4xlarge instances (running 4 executors pe r4xlarge), so the task fleet provides 16 executors / containers to the cluster. The core fleet launched one xlarge instance and it will run one executor / container, so in total 17 executors / containers will be running in the cluster.
- In your EMR cluster page, in the AWS Management Console, go to the Steps tab.
- Go to the Events tab to see the scaling events.
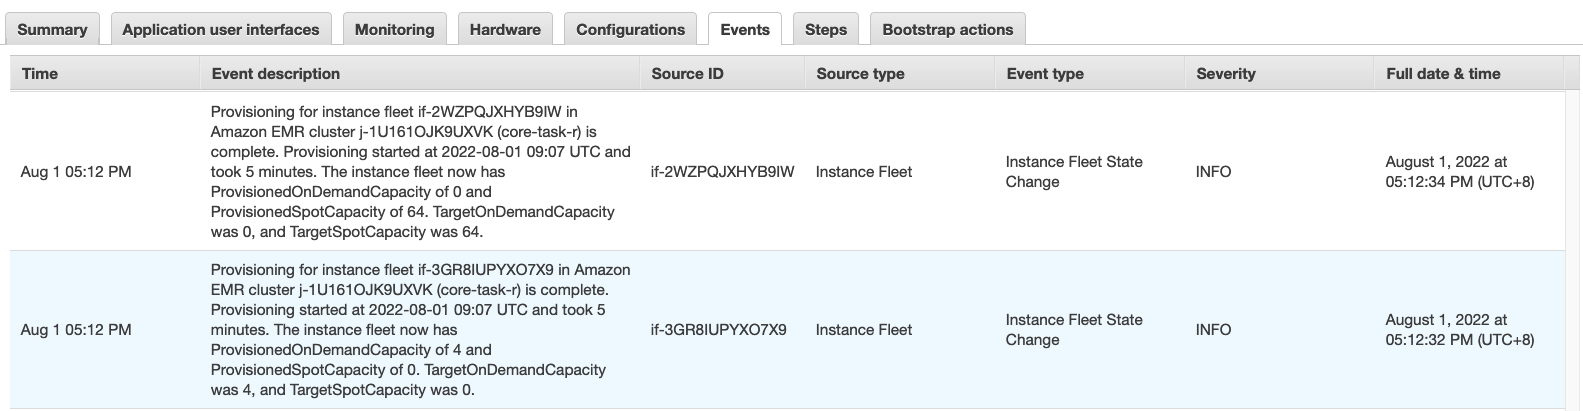
EMR Managed cluster scaling constantly monitors key metrics and automatically increases or decreases the number of instances or units in your cluster based on workload.
Your Spark application was configured to run in Cluster mode, meaning that the Spark driver is running on the Core node. Since it is counted as a container, this adds a container to our count, but it is not an executor.