Analyzing costs
In this section we will use AWS Cost explorer to look at the costs of our EMR cluster, including the underlying EC2 Spot Instances.
Select the correct tab, depending on where you are running the workshop:
 Please note: That this workshop has been deprecated. For the latest and updated version featuring the newest features, please access the Workshop at the following link: Cost efficient Spark applications on Amazon EMR.
This workshop remains here for reference to those who have used this workshop before, or those who want to reference this workshop for earlier version.
Please note: That this workshop has been deprecated. For the latest and updated version featuring the newest features, please access the Workshop at the following link: Cost efficient Spark applications on Amazon EMR.
This workshop remains here for reference to those who have used this workshop before, or those who want to reference this workshop for earlier version.
It will take 24-48 hours for your usage to appear in Cost Explorer, so you can plan to come back to this step later to check the costs of running the workshop. If your organization administrator has not granted you access to Billing information, then you will not be able to access Cost Explorer, but you can look at the examples provided below.
Please note: That this workshop has been deprecated. For the latest and updated version featuring the newest features, please access the Workshop at the following link: Cost efficient Spark applications on Amazon EMR.
This workshop remains here for reference to those who have used this workshop before, or those who want to reference this workshop for earlier version.
If you are running the workshop in an AWS event, you cannot perform this step since you do not have access to billing information in the account that was created for you. However, you can have a look at the example below, and use this step in the future as guidance on how to examine costs using Cost Explorer in your EMR workloads.
In Step 4 of the EMR cluster launch, we tagged the cluster with the following Tag: Key=Name, Value=emr-spot-workshop. This tag can be used to identify resources in your AWS account, and can also be used to identify the costs associated with usage in case the tag Key has been enabled as a Cost Allocation Tag. Click here to learn more about tagging in AWS.
Analyzing costs with AWS Cost Explorer
AWS Cost Explorer has an easy-to-use interface that lets you visualize, understand, and manage your AWS costs and usage over time. You can analyze cost and usage data, both at a high level (e.g. how much did I pay for EMR) and for highly-specific requests (e.g. Cost for a specific instance type in a specific account with a specific tag).
If the Name tag Key was not enabled as a Cost Allocation Tag, you will not be able to filter/group according to it in Cost Explorer, but you can still gather data like cost for the EMR service, instance types, etc.
Let’s use Cost Explorer to analyze the costs of running our EMR application.
- Navigate to Cost Explorer by opening the AWS Management Console -> Click your username in the top right corner -> click My Billing Dashboard -> click Cost Explorer in the left pane. or click here for a direct link.
- We know that we gave our EMR cluster a unique Name tag, so let’s filter according to it. In the right pane, click Tags -> Name -> enter “emr-spot-workshop”
- Instead of the default 45 days view, let’s narrow down the time span to just the day when we ran the cluster. In the data selection dropdown, mark that day as start and end.
- You are now looking at the total cost to run the cluster ($0.30), including: EMR, EC2, EBS, and possible AWS Cross-Region data transfer costs, depending on where you ran your cluster relative to where the S3 dataset is located (in N. Virginia).
- Group by Usage Type to get a breakdown of the costs
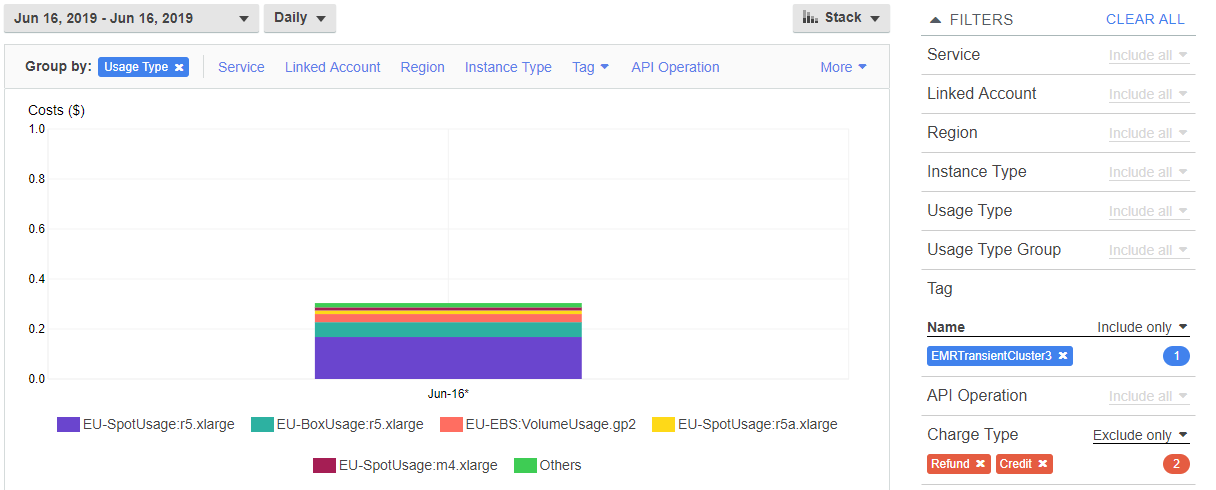
Above’s screenshot references to a sample workload deployed at an European region. You’ll get a similar graph regardless of the region.
- EU-SpotUsage:r5.xlarge: This was the instance type that ran in the EMR Task Instance fleet and accrued the largest cost, since EMR launched 10 instances ($0.17)
- EU-BoxUsage:r5.xlarge: The EMR costs. Click here to learn more about EMR pricing. ($0.06)
- EU-EBS:VolumeUsage.gp2: EBS volumes that were attached to my EC2 Instances in the cluster - these got tagged automatically. ($0.03)
- EU-SpotUsage:r5a.xlarge & EU-SpotUsage:m4.xlarge: EC2 Spot price for the other instances in my cluster (Master and Core) ($0.02 combined)
If you have access to Cost Explorer, have a look around and see what you can find by slicing and dicing with filtering and grouping. For example, what happens if you filter by Purchase Option = Spot & Group by = Instance Type?