Working with Custom Metrics
 Please note: This workshop version is now deprecated, and an updated version has been moved to AWS Workshop Studio. This workshop remains here for reference to those who have used this workshop before for reference only. Link to updated workshop is here: Efficient and Resilient Workloads with Amazon EC2 Auto Scaling.
In most use cases the predefined metrics are used to define and create a predictive scaling policy. However, you can use Custom metrics when the predefined metrics (CPU, network I/O, and Application Load Balancer request count) do not sufficiently describe your application load.
As mentioned in previous chapter you don’t have 24 hours data for predictive scaling to start forecasting. Therefore, as part of the CloudFormation stack you created, a bash script has been executed to update two CloudWatch custom metrics which can be used in creating the predictive scaling policy.
Verify in CloudWatch metrics using AWS Console
Verify scaling and load metrics data in CloudWatch.
- Navigate to Amazon CloudWatch Console.
- Make sure the correct region is selected in the AWS Console.
- From left side navigation, click on Metrics then All metrics.
- In the Browse tab select EC2 Workshop Custom Metrics under Custom namespaces
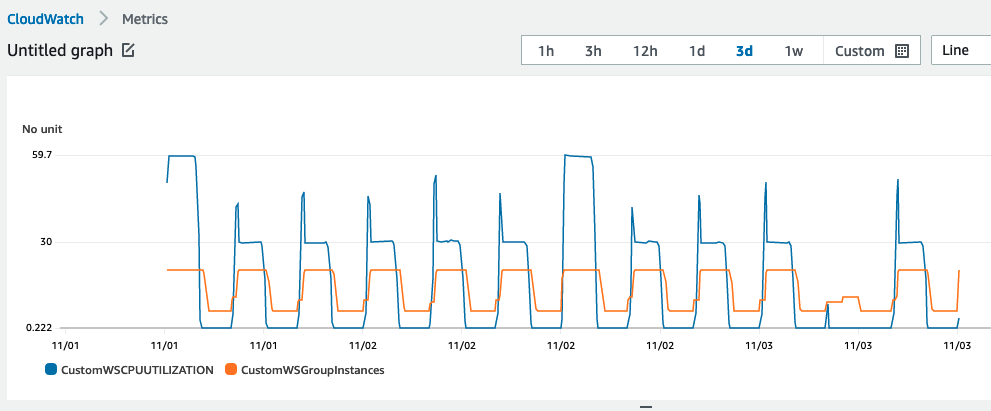
- Select AutoScalingGroupName, then select the two metrics attached with ec2-workshop-asg. This should add the metrics to the graph.
- To view all metrics data, from the time window filter select 3d to view data of the last 3 days
- Note the workload pattern in the custom metrics graph, this makes it a good use case for predictive scaling.
If you’re running the workshop in your own account, there might be up to 30 minutes delay for CloudWatch to make the metric data available.